What is Cilium
Cilium is a tool adhering to the CNI specification which is based on an innovative technology: eBPF.
Let’s define these two terms:
- CNI ( Container Network Interface ): A specification describing the characteristics that a Kubernetes plugin must have in order to guarantee a set of networking features of a cluster.
- eBPF ( extended Berkeley Packet Filter ): A method for allowing application code to be integrated in an isolated and protected manner into the Linux kernel. It is therefore an effective way to view, modify, and act on the network layer of a Linux system.
Thanks to eBPF, Cilium is able to manage network flows directly in the kernel, and thus makes it possible to address a certain number of issues such as:
- Load Balancing
- Controlling network flows (Network Policies) in the different OSI layers (L3, L4, and L7)
- The meshing of services, even clusters
Cilium Installation
We will be looking at Cilium in its version 1.13. Naturally, things will change later, so do not hesitate to refer to the excellent and very complete Cilium documentation .
Prerequisites
In order to easily create and configure a k8s cluster with Cilium we recommend using a Linux distribution that supports cgroups v2 by default . This is commonly already the case on recent LTS distributions (Ubuntu 22, for example).
Creating a Kubernetes Cluster
Let’s start at the beginning with the installation of Cilium because this step alone will reveal to us some key features of the tool, including its relationship with cgroups v2 and how to manage the implementation of eBPF.
For this example case, we will start from a local Kubernetes installation with k3d , which has the advantage of simply simulating a cluster with several nodes and allowing a fairly low-level configuration of k3s (the underlying layer that actually manages the nodes). Other options are possible, such as with kind for example, or you can use VMs and make a cluster out of them using k3s or Rancher Kubernetes Engine .
As we want to change the CNI of k3d (default flannel) to Cilium, we must specify it at creation:
$ k3d cluster create \
        local-cilium \
        --agents 3 \

       # Here we indicate that we will disable the default load-balancer of k3s (kube-proxy)
         --k3s-arg "--disable=servicelb@server:*" \
        --k3s-arg "--disable=traefik@server:*"  --no-lb \

        # Here we indicate that we will disable the default CNI of k3s
         --k3s-arg "--flannel-backend=none@server:*" \
        --k3s-arg "--disable-network-policy@server:*" \

        --wait
Normally, at this stage, the cluster should mount, but in an unstable state: indeed, our cluster has no CNI! It is difficult for the system pods (coredns, metrics, etc.) to find their way around… As long as we have not installed Cilium, they will not be able to progress in their initialization.
Installation
In order to install Cilium under k3d, we will need an intermediate step, the configuration of the eBPF and cgroups v2 mount points. This step is apparently not necessary for kind so feel free to refer to the documentation of your orchestrator or the documentation of the underlying distribution of your containers/VMs to determine what you need.
In the case of our k3d cluster, it will therefore be necessary, for each node of the cluster, to carry out the following operations:
# CLUSTER_NAME contient le nom du cluster
$ for node in $(k3d node list --no-headers | grep ${CLUSTER_NAME} | cut -d " " -f1); do
    docker exec -it $node mount bpffs /sys/fs/bpf -t bpf
    docker exec -it $node mount --make-shared /sys/fs/bpf
    docker exec -it $node mkdir -p /run/cilium/cgroupv2
    docker exec -it $node mount -t cgroup2 none /run/cilium/cgroupv2
    docker exec -it $node mount --make-shared /run/cilium/cgroupv2/
done
Let’s decipher all this a little:
- The first two mounts make sure to mount BPF in a shared manner in each node
- The next two make sure to create another shared mount point, in the same way, for cgroups v2.
Given the manual mounts, it should be kept in mind that restarting containers will not take them into account. If you plan to use a cluster that will survive a system reboot, it will be better to move towards a cluster with VMs, such as k3s + multipass for example.
Now all that remains is to install Cilium itself, and rather than using a supplied command line (which would require us to install it locally), we will do it using the dedicated Helm Chart:
$    helm repo add cilium https://helm.cilium.io/

$   helm upgrade cilium cilium/cilium --version 1.13.0 \
        --install \
        --namespace kube-system \
        --set ipam.mode=kubernetes
Nothing special there: we base ourselves on the Helm Chart provided by Cilium, to which we specify that we are on IPAM management ( IP Address Management : quite simply the way in which an application will assign IP addresses to entities (pods, services, etc.) in “Kubernetes” mode.
Now that the configuration is done, the cluster already looks healthier: the nodes have moved to Ready because their network configuration is complete. The other system pods (coredns, metrics, etc.) should schedule correctly this time.
Cilium CLI
Cilium has a command (aptly named cilium), which can be executed from the Cilium agent pods, and which allows you to interact with them, which is very useful for debugging:
$ kubectl -n kube-system exec ds/cilium -- cilium status

Defaulted container "cilium-agent" out of: cilium-agent, config (init), mount-cgroup (init), apply-sysctl-overwrites (init), mount-bpf-fs (init), clean-cilium-state (init)
KVStore:                 Ok   Disabled
Kubernetes:              Ok   1.25 (v1.25.6+k3s1) [linux/amd64]
Kubernetes APIs:         ["cilium/v2::CiliumClusterwideNetworkPolicy", "cilium/v2::CiliumEndpoint", "cilium/v2::CiliumNetworkPolicy", "cilium/v2::CiliumNode", "core/v1::Namespace", "core/v1::Node", "core/v1::Pods", "core/v1::Service", "discovery/v1::EndpointSlice", "networking.k8s.io/v1::NetworkPolicy"]
KubeProxyReplacement:    Strict   [ens3 198.20.0.4]
Host firewall:           Disabled
CNI Chaining:            none
CNI Config file:         CNI configuration file management disabled
Cilium:                  Ok   1.13.0 (v1.13.0-c9723a8d)
NodeMonitor:             Listening for events on 1 CPUs with 64x4096 of shared memory
Cilium health daemon:    Ok
IPAM:                    IPv4: 8/254 allocated from 10.42.0.0/24,
IPv6 BIG TCP:            Disabled
BandwidthManager:        Disabled
Host Routing:            Legacy
Masquerading:            IPTables [IPv4: Enabled, IPv6: Disabled]
Controller Status:       49/49 healthy
Proxy Status:            OK, ip 10.42.0.88, 1 redirects active on ports 10000-20000
Global Identity Range:   min 256, max 65535
Hubble:                  Ok   Current/Max Flows: 4095/4095 (100.00%), Flows/s: 13.61   Metrics: Disabled
Encryption:              Disabled
Cluster health:          3/3 reachable   (2023-03-01T15:57:05Z)
Running the kubectl command through the DaemonSet (ds/cilium) is very convenient when you want general information, and avoids having to remember the precise name of a pod.
The Cilium CLI also allows you to view Cilium’s operating logs, including communications between endpoints.
This notion of endpoint is sufficiently central to Cilium for us to detail it a little:
$ kubectl -n kube-system exec ds/cilium -- cilium endpoint list

ENDPOINT   POLICY (ingress)   POLICY (egress)   IDENTITY   LABELS (source:key[=value])                     IPv6   IPv4          STATUS
          ENFORCEMENT        ENFORCEMENT
191        Disabled           Disabled          57155      k8s:app=yelb-appserver                                 10.42.0.36    ready
1155       Disabled           Disabled          2358       k8s:app=redis-server                                   10.42.0.29    ready
2950       Enabled            Disabled          37504      k8s:app.kubernetes.io/name=deathstar                   10.42.0.158   ready
Endpoints are one of the fundamental entities of Cilium: they are the ones that send (or not) traffic according to the rules established in Cilium, and it is through them that traffic monitoring is done.
For example, if I have a service named deathstar, the cilium endpoint list command will show me that it has an ID. This ID can then be used by other commands such as cilium monitor which allows you to display the logs related to this endpoint (here the endpoint ID 2950 corresponds to the deathstar service):
$ kubectl -n kube-system exec ds/cilium -- cilium monitor --related-to 2950

Listening for events on 1 CPUs with 64x4096 of shared memory
Press Ctrl-C to quit
level=info msg="Initializing dissection cache..." subsys=monitor
Policy verdict log: flow 0x0 local EP ID 2950, remote ID 600, proto 6, ingress, action redirect, match L3-L4, 10.42.2.199:55910 -> 10.42.0.158:80 tcp SYN
Policy verdict log: flow 0x0 local EP ID 2950, remote ID 59358, proto 6, ingress, action deny, match none, 10.42.1.32:54814 -> 10.42.0.158:80 tcp SYN
xx drop (Policy denied) flow 0x0 to endpoint 2950, ifindex 23, file 2:1903, , identity 59358->37504: 10.42.1.32:54814 -> 10.42.0.158:80 tcp SYN
Policy verdict log: flow 0x0 local EP ID 2950, remote ID 59358, proto 6, ingress, action deny, match none, 10.42.1.32:54814 -> 10.42.0.158:80 tcp SYN
xx drop (Policy denied) flow 0x0 to endpoint 2950, ifindex 23, file 2:1903, , identity 59358->37504: 10.42.1.32:54814 -> 10.42.0.158:80 tcp SYN
You can see in the above result first a request that was accepted (redirect action) as well as a request that was blocked (deny action).
Cilium offers a wide variety of options and trace levels for its different commands to allow very fine analysis of configurations and their consequences.
For a more “high level” vision, a tool that is part of the Cilium suite provides a synthesis of this information in near real time: Hubble .
Hubble – observability according to Cilium
Hubble is an application associated with Cilium and which has the characteristic of being able to use, it too, the eBPF for its observability objectives. It is presented as a web application that materializes what Cilium sees of the exchanges between the different endpoints. This is what we call the Service Map . But one of the great strengths of Cilium being the management and control of traffic, Hubble also allows to visualize the traffic that has not been routed, and thus to diagnose possible configuration or security problems.
Hubble is very easy to activate if you have already deployed the Cilium Helm Chart:
$ helm upgrade cilium cilium/cilium --version 1.13.0 \
    --namespace kube-system \
    --reuse-values \
    --set hubble.listenAddress=":4244" \
    --set hubble.relay.enabled=true \
    --set hubble.ui.enabled=true
Then you just need to reach the service (either by port forwarding or by exposing the service outside the cluster, but we’ll come back to that later) with a web browser to access the Hubble GUI:
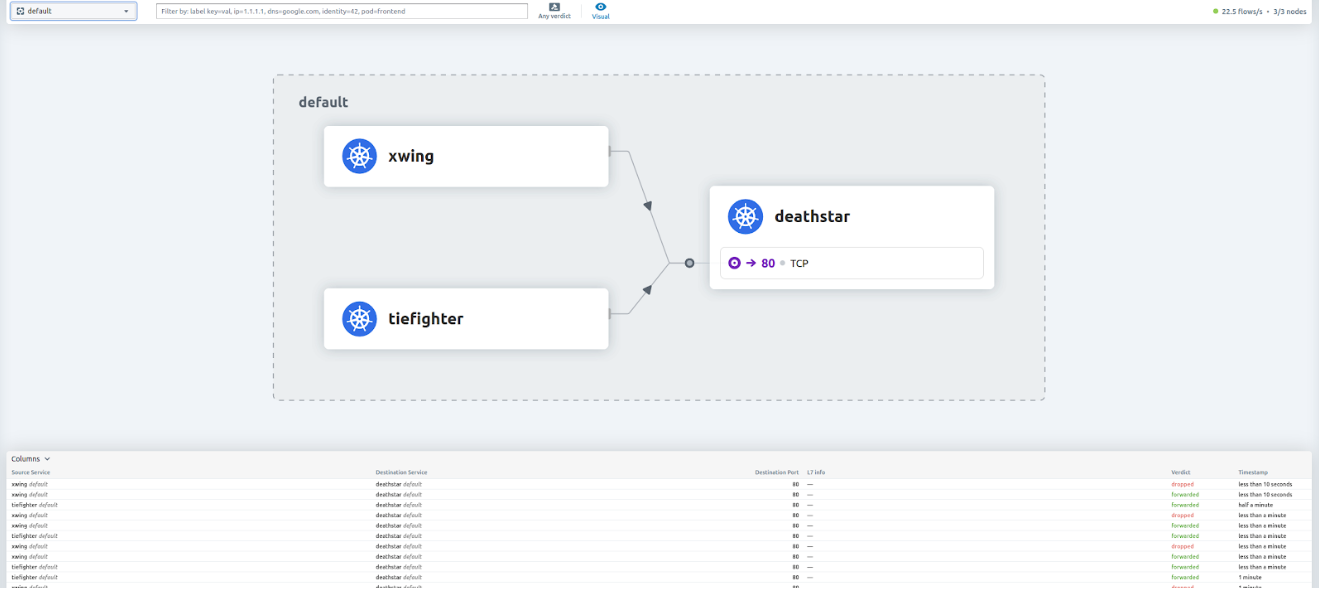
In the currently deployed configuration (found in the Cilium documentation), a deathstar service can be queried by two pods: xwing and tiefighter.
You can see in the previous image that the traffic coming from tiefighter is accepted by deathstar where the one from xwing is “dropped” (not routed). This is due to a routing rule that we will see later.
That being said, Hubble is also accessible in CLI with options that allow to filter the logs, in the same way as on the GUI:
$ kubectl -n kube-system exec ds/cilium -- hubble observe -t trace --since 10s

Defaulted container "cilium-agent" out of: cilium-agent, config (init), mount-cgroup (init), apply-sysctl-overwrites (init), mount-bpf-fs (init), clean-cilium-state (init)
Mar  1 15:47:22.933: 198.20.0.4:58110 (host) -> kube-system/metrics-server-5f9f776df5-886rz:10250 (ID:30296) to-endpoint FORWARDED (TCP Flags: SYN)
Mar  1 15:47:22.933: 198.20.0.4:58110 (host) <- kube-system/metrics-server-5f9f776df5-886rz:10250 (ID:30296) to-stack FORWARDED (TCP Flags: SYN, ACK)
Mar  1 15:47:22.933: 198.20.0.4:58110 (host) -> kube-system/metrics-server-5f9f776df5-886rz:10250 (ID:30296) to-endpoint FORWARDED (TCP Flags: ACK)
Mar  1 15:47:22.934: 198.20.0.4:58110 (host) -> kube-system/metrics-server-5f9f776df5-886rz:10250 (ID:30296) to-endpoint FORWARDED (TCP Flags: ACK, PSH)
Conclusion
Now that we have a working Cilium and Hubble, we can dive into some use cases for a Kubernetes CNI.
This is what we will cover in the next two articles, so stay tuned by subscribing to our newsletter or following us on the various social networks


![[Solved] Couldn't get current server API group list](https://teckbootcamps.com/wp-content/uploads/2024/09/de-43-380x220.png)
![[Solved] ClusterInformation: connection is unauthorized](https://teckbootcamps.com/wp-content/uploads/2024/09/de-42-380x220.png)
![[Solved] Kubernetes DNS Error: curl: (6) Could not resolve host](https://teckbootcamps.com/wp-content/uploads/2024/09/de-41-380x220.png)

